
First thing was to setup the database on my Web server which is running Server 2008 R2 on my VMWare ESXi server. I ended up using the Web Platform installer to install MySQL 5.1 and PHP. I probably won’t need PHP, but just in case. This is the same server that is running the SBot web interface in ASPX .NET.
Originally, I was going to use CSV as the datebase engine in case I wanted to read the data directly but in the end I decided in just using MyISAM. Here is a screenshot of how I set the table called motion.
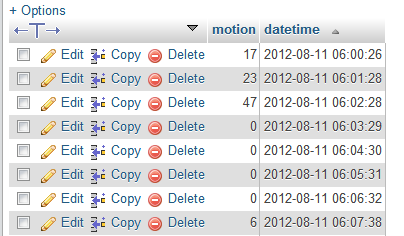 |
| PIR Logging Table |
Also, I was going use a C program to log the data and create the graph but I had a hard time figuring out how to install SQLAPI++ on the Pi. In talking to a friend, I remembered that many people use Python on the Pi and there is a GPIO library for it. I haven’t used Python but this looked to be a perfect opportunity to learn it.
Python comes pre-installed on the Raspbian so all you need is the additionally library’s for your project. Here is a list of what I installed for Python.
GPIO
http://code.google.com/p/raspberry-gpio-python/
MYSql
http://zetcode.com/databases/mysqlpythontutorial/
MatPlotLib
http://matplotlib.sourceforge.net/users/installing.html
$ sudo apt-get install python-matplotlibFor some reason I had a hard time enabling remote access to the MySql database. I then realized in myPhpAdmin you can select the host when you create a user. D’oh!
http://www.cyberciti.biz/tips/how-do-i-enable-remote-access-to-mysql-database-server.html
Now that MySql is setup I can setup a Python script to log the sensor data. I started with a basic script to test SQL connectivity and then built it up to this. Originally the script would loop and check to see if certain time has past to take a reading but this would cause the Pi to run at 100% CPU usage so I ended using the sleep function for 600 milliseconds.
 #!/usr/bin/python
 #PIR LOGGING TO MYSQL
 import RPi.GPIO as GPIO
 import MySQLdb as mdb
 import sys
 import time
 import datetime
 from datetime import timedelta
 def writeDB(status):
      try:
             con = mdb.connect('server', 'database', 'uname', 'pass')
             cur = con.cursor()
             #cur.execute("SELECT VERSION()")
             #data = cur.fetchone()
             #print "MySQL version: %s" % data
             cur.execute("INSERT INTO motion(motion, datetime) VALUES(%s, %s)", (status, datetime.datetime.utcnow()))
             print '%s @ %s' % (status, datetime.datetime.utcnow())
      except mdb.Error, e:
             print "Error %d: %s" % (e.args[0], e.args[1])
             sys.exit(1)
      finally:
              if con:
               con.close()
      return
 con = None
 ledPin = 17
 pirPin = 18
 motionCount = 0
 timerMin = 5 #Number of minutes between database writes
 GPIO.setmode(GPIO.BCM)
 GPIO.setup(ledPin, GPIO.OUT)
 GPIO.setup(pirPin, GPIO.IN)
 loop = 1
 while loop == 1 :
      GPIO.output(ledPin, GPIO.HIGH)
      time.sleep(.5)
      GPIO.output(ledPin, GPIO.LOW)
      startTimer = datetime.datetime.utcnow()
      #startTimer2 = startTimer
      while datetime.datetime.utcnow() < startTimer+timedelta(minutes=timerMin) :
           #if datetime.datetime.utcnow() >= startTimer2+timedelta(milliseconds=600) :
           motionCount+=GPIO.input(pirPin)
           time.sleep(.60)
           #startTimer2 = datetime.datetime.utcnow()
      #motionCount = ((motionCount/500)*100)
      writeDB(motionCount)
      motionCount = 0
 print "Done"
During testing, I was logging every minute so I wouldn’t have to wait forever to see the results. Afterwards I set it to do 5 minute intervals. I tried to convert that to a percentage but then the quick motion wouldn’t register. So now the graph is set to 500 max instead of 100.
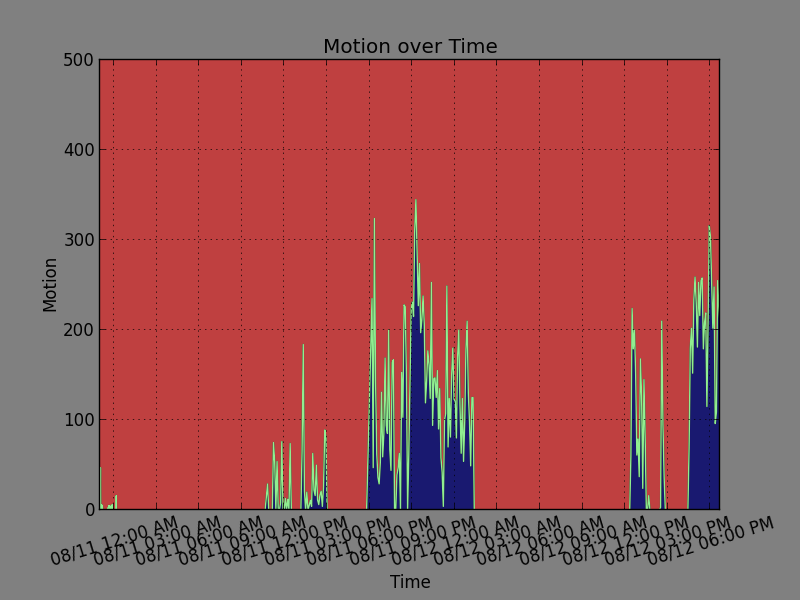
With that working I moved onto graphing. I pretty much spent the whole night and them some just getting Matplotlib to do what I wanted. Most of the trouble was getting the X axis time to show up correctly. I wanted it to be local time in a 12hr format. The logging is done in UTC 24hr format. Let me say again: it was a pain! But at last, at 1 AM, I got it looking how I wanted. I used a lot of different sites to figure out how to use the Matplotlib, here is one site that helped: http://codejourneys.blogspot.com/2008/05/using-matplotlib-to-plot-data-from.html.
 #!/usr/bin/python
 #PIR GRAPHING FROM MYSQL
 # Force matplotlib to not use any Xwindows backend.
 import matplotlib
 matplotlib.use('Agg')
 import matplotlib.pyplot as plt
 import matplotlib.dates as mdates
 import pytz
 import datetime
 from datetime import datetime
 import MySQLdb as mdb
 import sys
 import time
 def readDB():
      try:
             con = mdb.connect('server', 'database', 'uname', 'pass')
             cur = con.cursor()
             cur.execute("SELECT * FROM motion ORDER BY datetime ASC")
             rows = cur.fetchall()
             return rows
      except mdb.Error, e:
             print "Error %d: %s" % (e.args[0], e.args[1])
             sys.exit(1)
      finally:
              if con:
               con.close()
      return
 loop = 1
 while loop == 1:
      rows = readDB()
      t = []
      m = []
      for record in rows:
           m.append(record[0])
           t.append(record[1])
      pst=pytz.timezone('US/Pacific')
      #days = mdates.AutoDateFormatter(mdates.AutoDateLocator(t), )
      days = mdates.date2num(t)
      daysfmt = mdates.DateFormatter('%m/%d %I:%M %p', tz=pst)
      fig = plt.figure()
      ax = fig.add_subplot(111)
      #ax.vlines(days, y2, y1)
      plt.plot_date(days, m, 'b-', xdate=True, fillstyle='bottom', color='lightgreen')
      plt.axis([min(days), max(days), 0, 500])
      ax.xaxis.set_major_formatter(daysfmt)
      ax.fill_between(days, m, facecolor='MidnightBlue')
      ax.patch.set_facecolor('red')
      ax.patch.set_alpha(0.5)
      plt.xticks(rotation=17)
      plt.subplots_adjust(bottom=.15)
      plt.grid(True)
      plt.ylabel('Motion')
      plt.xlabel('Time')
      plt.title("Motion over Time")
      plt.savefig('/var/www/ram/pir.png', bbox_inches=0, facecolor='gray', edgecolor='black')
      print "Saved Graph"
      time.sleep(300)
 print "Done"
I am not sure how I want to scale the graph, for now the y is set to 500 and x is scaled automatically. I might end up doing different graphs for different time frames, like hourly, weekly, and so on. I might also look into using this http://oss.oetiker.ch/rrdtool/ instead of matplotlib which is what a friend uses. I didn’t have a chance to ask him before I started using Matplotlib but I did learn a lot doing it.
Before I setup the script to run continuously I wanted to set it up in a way that it isn’t constantly writing to the SD card. I ended up setting up a ram-disk in the web folder to host the image. Here is how I did it. I haven’t set it up to auto mount on boot yet. I will probably set it up in /etc/rc.local along with auto starting the Python scripts.
http://www.techtach.org/using-and-mounting-a-ram-disk-in-ubuntu-the-easy-way
$ mkdir -p /var/www/ram
$ sudo mount -t tmpfs -o size=1M tmpfs /var/www/ram
You can adjust the ram size as needed, but in this case we just want to store a small image.
I added the image to the same page I setup for controlling the IR devices. That last part is to have it auto refresh the image and not the whole page. I tried different ways and this is what ended up working inside of a PHP page.
 <script language="JavaScript">
 function reloadImage() {
   var now = new Date();
   if (document.images) {
     document.images.myImageName.src = '/ram/pir.png?' + now.getTime();
   }
   setTimeout('reloadImage()',60000);
 }
 setTimeout('reloadImage()',60000);
 </script>
 <img src="/ram/pir.png" name="myImageName">
Now that this proof of concept works I can build upon it. The more I think about it, the more ideas I keep coming up with and different ways my home automation system can use the data. I was thinking I can add an Xbee to the Pi and it can be an Xbee hub. It can be an Xbee coordinator and logging to MySQL, without having to rely on a desktop PC. The ideas are endless. I can’t wait to build out my home automation system. I think I am getting to a point where I should start designing a framework instead of piecing together working pieces of code.